
Written by: Senior QA Engineer
Mykhailo RalduhinPosted: 14.11.2016
6 min read
JMeter is a very powerful tool for load testing with the ability to create a large number of requests at the same time thanks to parallel work on multiple computers. It supports plugins to extend its functionality. The tool can be used for testing huge Internet banking systems. In this post, I will describe how to use JMeter for load testing of your project.
You can easily download JMeter here. Go to \bin\JMeter.bat to start it.
How to do load testing using JMeter?
When running the program, you will see 2 issues on the left side: Test Plan and WorkBench. Let's add a Thread group into the Test plan by right-clicking on the Test plan -> Add -> Threads (Users) - Thread group.
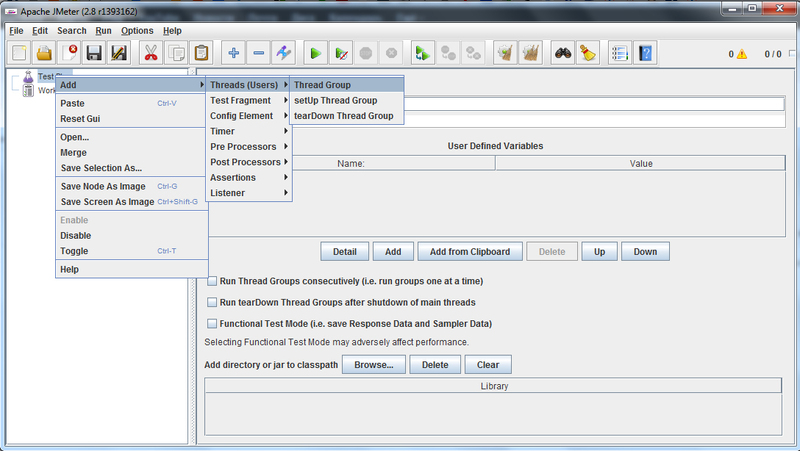
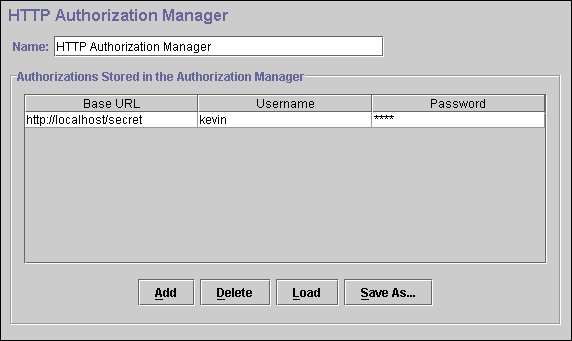
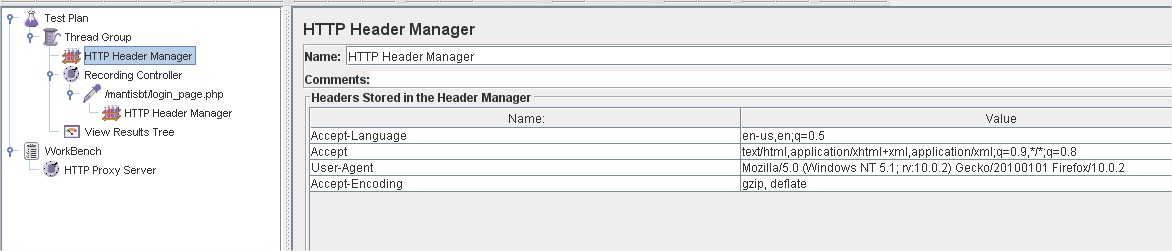
Now we'll create test settings elements inside the Thread group: right-click the Thread group -> Add -> Config Element and select 4 points in succession:
The next thing we will do with JMeter for load testing is adding HTTP Proxy Server. Right-click the WorkBench -> Add -> Non-Test Elements -> HTTP Proxy Server. Then specify any unique port address (you can use 8089) In the setting of HTTP Proxy Server and remove the tick next to Capture HTTP Headers. 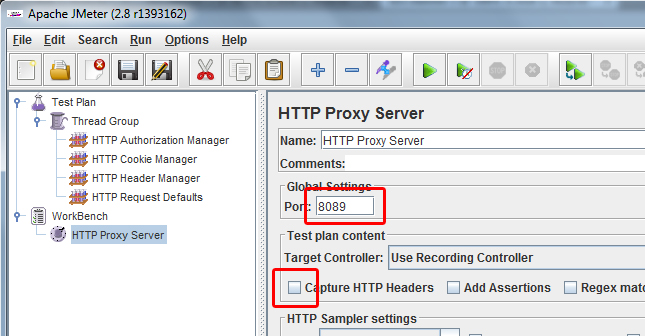
Now let's go to any browser to configure a proxy server. We prefer Firefox for such purposes. In the network settings, specify the use of a proxy and enter localhost for HTTP Proxy, 8089 for port. Do not forget to remove the exception for the localhost.
We're now back in JMeter for load testing in the HTTP Proxy Server and it's time to click the Start button. Now we're back in the browser to load all the interfaces that require load testing.
Now go back in JMeter and click Stop in the HTTP Proxy Server.
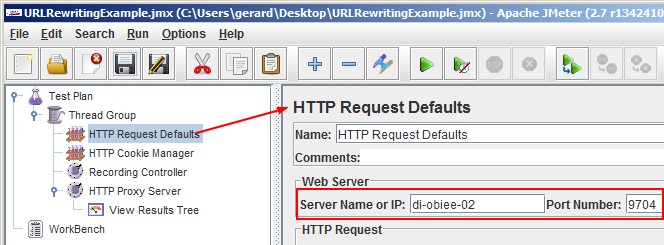
Note! In a situation when you need to edit the host settings in the package that's different from the HTTP Request Defaults, it is more convenient to do the following. Save the project (File -> Save), and close it. Open the saved \*.jmx file using Notepad ++ (or Notepad) and delete the values for all rows:
- domain;
- port;
- protocol;
- and all other parameters that need to be changed.
Save the file and open it in JMeter. We return the value to the HTTP Request Defaults. Now they also apply to those requests with their own settings specified.
It's high time to clean the project from unnecessary information. Some packages refer to third-party services, for which we do not have to create a load. They need to be removed. To do this, you need to go through them all and see which Server Names or IPs are set. If the server name is not related to the test resource, we do not create additional load on it. Just delete them:
The last setting before running the test is specifying the number of users (Number of Threads) and the number of iterations (Loop Count) by clicking on the Thread Group and setting the appropriate parameters.

All is ready. Start the test by pressing the green triangle on the top panel and open any of the elements to view the online statistics is in front of you. As we've installed the Loop Count - Forever, press the Stop after testing. Now, it's time to analyze the results.
How to use JMeter for load testing: Analysis of Results
Graph Results displays the result as follows:
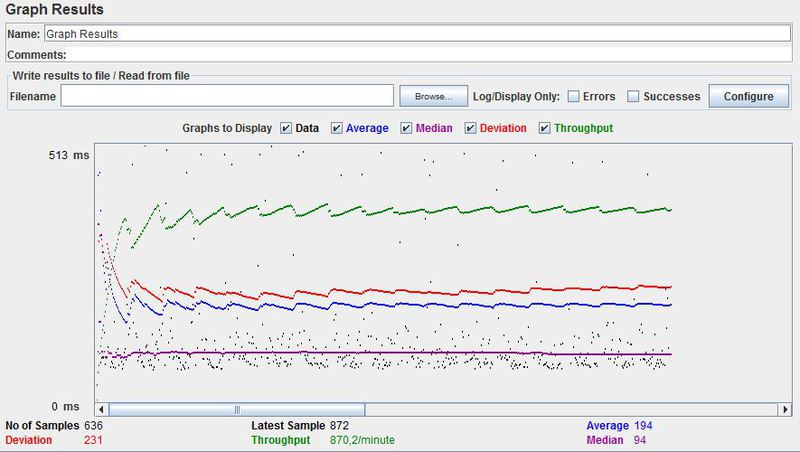
Average and Throughput values are quiet enough for work, which will display the load on the web server and queries bandwidth. The graph above shows that the response time of about 200ms and it is not growing. That is, the server can withstand normal load of 3 virtual user. But what happens if there are 30 of them: 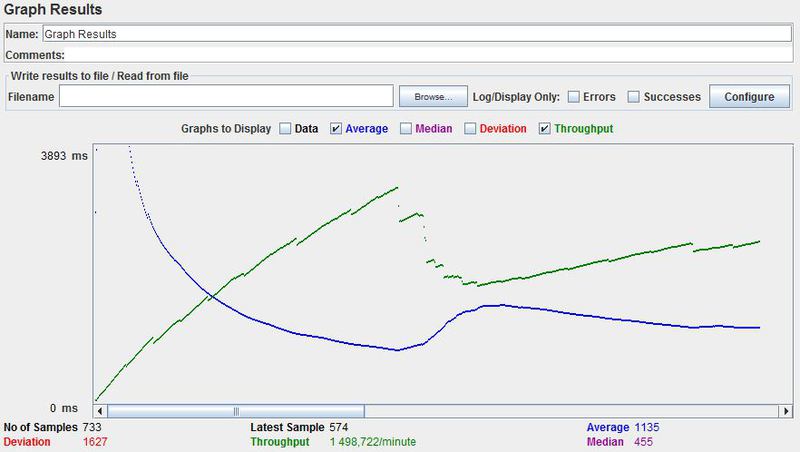
The response time has significantly increased, the higher the requests bandwidth (less than a millisecond), the more time the server requires for processing.
Aggregate Report displays statistics for each individual URL separately:

The Average column shows the average response time, it is logical to assume that the bigger it is, the greater the load on the URL is.
View Result in Table displays the results with time and status (successful / not successful).
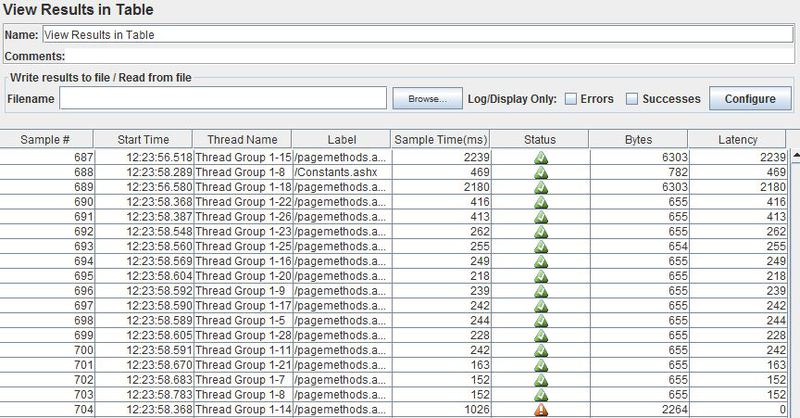
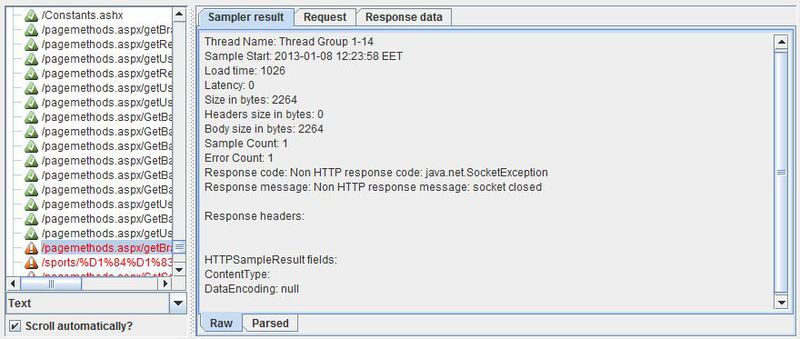
There's an error at the bottom line. You can check the reason for this in View Result Tree. Let's go over there and find this line. Now we see the cause of the error.
Now the load testing is completed. We've checked out one of the web applications and received great results.
About the author
Senior QA engineer
Mykhailo Ralduhin is a Senior QA Engineer at DeviQA, specializing in building stable, well-structured testing processes for complex software products.