
Written by: Senior AQA Engineer
Ievgen IevdokymovPosted: 30.11.2016
6 min read
Before you rush into your first battle, we should first figure out what we want to get as a result of testing. After verification, as well as any other work, we prepare in advance. When all the aims are not adequately formulated, we can get results that do not adequately reflect the real situation.
Based on the expected load, a Web server, you must define the test criteria. Define what will be considered as a success, and what will be an unacceptable work (e.g., response time, download time).
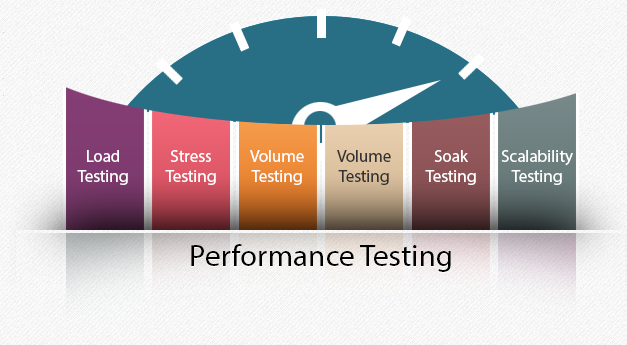
There are three variants of testing:
Load testing is determined by the system efficiency with some strictly specified (planned) load.
Stress testing is used for checking system parameters in abnormal and extreme conditions. The primary task during this test is to try to disrupt the system. It lets you to define a minimum required quantities of system resources for assessing limiting capabilities of the system and the factors that limit these capabilities. It is also determined by the ability of the system to preserve data after extraordinary cases.
Performance testing is a complex checkup including the previous two tests, designed to assess all the scorecards.
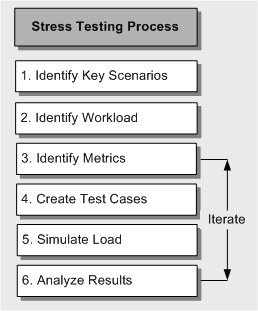
What is stress testing in Software Testing?
Let's define what stress testing is via the expected results:
the record of maximum number of users who may get simultaneous access to the website;
the number of processed requests or server response time.
Basing on results, a webmaster and network administrator can advance to identify bottlenecks that occur due to unbalanced work of components and correct such before including system into a real job.
During testing, we simulate the behavior of several hundreds or thousands of visitors. For more actual results, each virtual user can wander on the site according to the original scenario and personal options. Also, in the testing process, we can simulate short time peaks load, when the number of visitors increases explosively which is right to life for sites with the uneven audience.
Stress Testing in Software Testing: Tips and Tricks
So to conduct a complete testing, you need to know the following testing tips and tricks:
calculate how many visitors you plan to have in average and in peak load, and a quarter of peak load;
decide whether multiple users can have the same IP-address and/or Login/Password;
calculate the average number of pages viewed by a single user, whether there is a difference in behavior between registered and anonymous users, the proportion of such users and the number of sessions;
find out the presence of dynamic pages and pages that change during a particular period, and how often it occurs;
find out whether there's an email verification for user registration confirmation;
determine whether the users allow cookies or not and whether it is used on the site or not;
find out whether you want a confirmation of user account by a third party or remote server (for example, you need to know a credit card number), and whether that server provides information for testing;
find out the available bandwidth, its average width for one user;
see whether multiple users can cause any collision;
know whether there's a secure HTTPS-connection;
determine whether Java applets are used, stream media, special plug-ins, what is required on the client side for their support;
know whether page caching is used;
analyze all planned technical activities that may affect the server, and the time of their execution (synchronization, archiving, etc.).
Any of these actions and parameters may change the end result. It's not necessary for all the checks to be included in one test. They can be divided into a primary task and into subtasks.
For example, monitoring the system (servers: the web, application, database) and testing individual modules (servlets, scripts and so on, for instance, authentication checkup when there's a large number of users). As a result, testing issues two types of graphs: linear and nonlinear.
In the first case, the response time remains constant when the load is increasing. With further increase of the load, the response time also increases (almost linearly). And, finally, there comes a situation similar to the DOS-attack, when the time Response increases infinitely. Now that a plan of action is ready, it's high time to go to a brief review of tools that will help you to implement all the steps.
What is Stress Testing like with Open Systems Testing Architecture?
OpenSTA is more than a testing application. It's open architecture, designed according to open standards. It was created in 2001 by CYRANO company which supported the commercial version of the product. But CYRANO collapsed a long time ago, and now OpenSTA application is distributed as open source software under the license of GNU GPL. It runs in Windows NT 4.0SP5 / 2000 / XP / Win 7 / Win 10.

Current tools let you conduct HTTP / HTTPS stress test services, although its architecture is capable for more. OpenSTA allows creating test scripts in SCL (Script Control Language). To simplify the creation and editing of scenarios illumination, you can use a special tool called Script Modeler.
Choose Tools -> Canonicalize URL -> Launch your Web browser. Just wander on the site collecting links to be stored in the script. All request parameters can be edited, it is possible to change variables. Test Structure and titles will be displayed in tabs on the left. Tests are conveniently combined into sets. 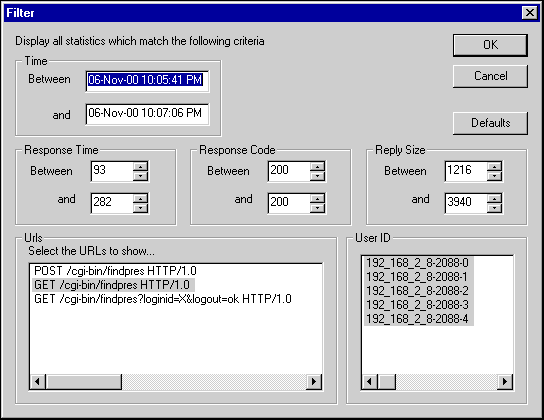
Proxy settings are fixed in the script so you can specify multiple servers. There's an opportunity for distributed testing that improves the realism, or when one computer fails to overload an authoritative server. Each of such machines of the system can perform its tasks group and the repository host collects and stores the results.
A name server runs on each of the systems after it's installed, which is obligatory. Authentication of users on the web-site and on the establishment of SSL connection is supported. You can control the parameters of the system with SNMP and Windows NT resources.
Test results including response time, the number of bytes transferred per second, response codes for every request and errors are displayed in the form of tables and graphs. Using the bigger number of filters lets you to select the necessary results. The result can be exported into a CSV-file.
About the author
Senior AQA engineer
Ievgen Ievdokymov is a Senior AQA Engineer at DeviQA, focused on building efficient, scalable testing processes for modern software products.